Tracing Player Conversion Curves via Automated Monitoring in Virtual Wagering Environments
Elena Simon · Jul 2, 2026
Tracing Player Conversion Curves via Automated Monitoring in Virtual Wagering Environments
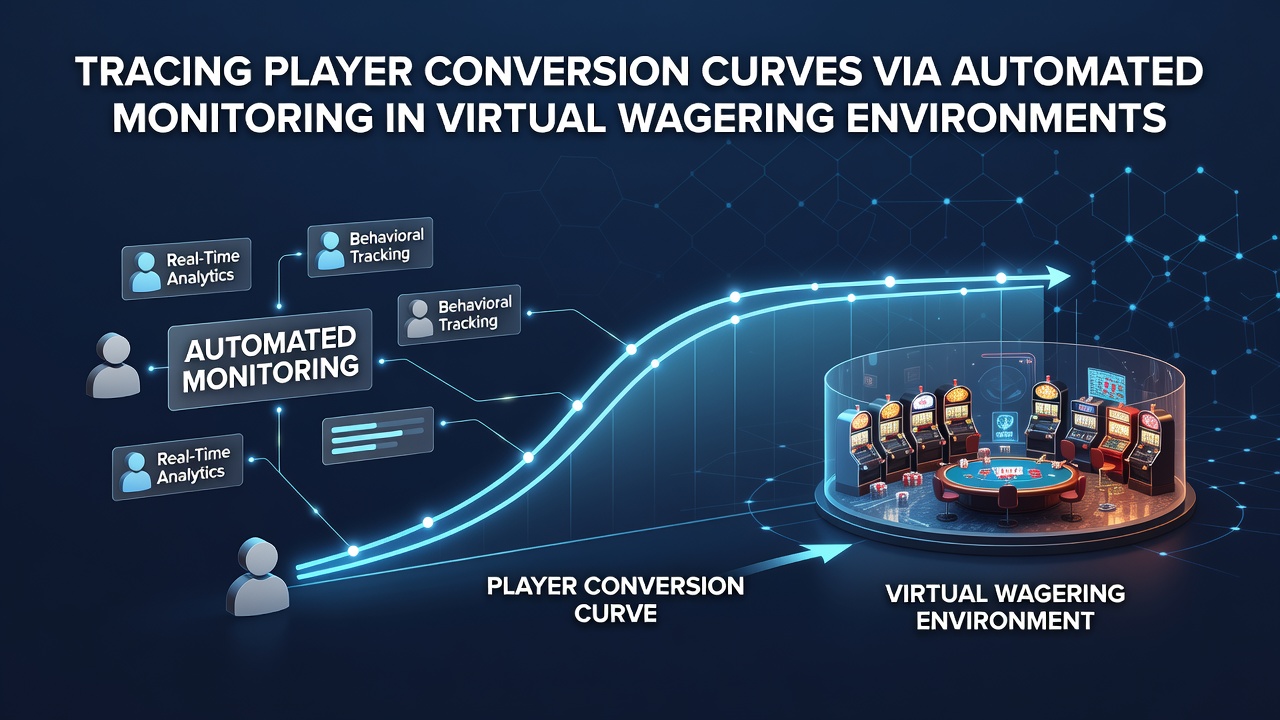
Virtual wagering environments rely on detailed tracking systems that map every stage of user movement from initial site visits through account creation and eventual betting activity, and automated monitoring tools generate conversion curves that plot these transitions over time. These curves reveal drop-off points where potential players abandon the process along with acceleration zones where engagement increases after specific triggers like bonus offers or simplified login sequences. Data pipelines collect timestamps, click paths, and device identifiers continuously, which allows platforms to construct accurate visualizations without manual intervention.
Defining Conversion Curves in Digital Betting Contexts
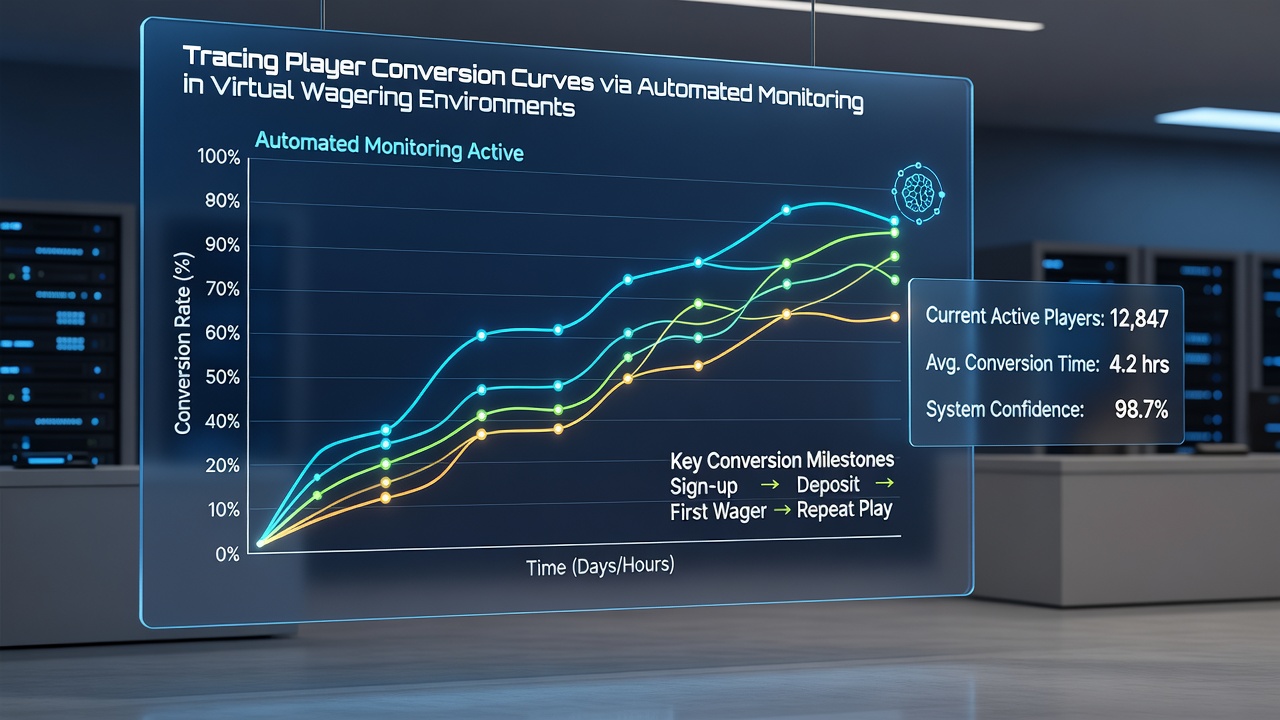
Conversion curves represent graphical representations of user progression rates across defined milestones such as homepage arrival, registration completion, verification steps, and first wager placement. In practice these lines slope upward when monitoring systems detect higher retention between stages, while steep declines indicate friction in forms or payment gateways. Researchers have documented how platforms adjust interface elements based on curve inflections recorded during peak traffic periods, and automated scripts flag anomalies like sudden spikes in mobile abandonments that differ from desktop patterns.
Core Components of Automated Monitoring Systems
Modern implementations integrate server-side logging with client-side event trackers that feed information into centralized databases for curve generation. Scripts written in languages such as Python or specialized analytics frameworks process incoming streams in batches or near real time, calculating conversion percentages at each funnel layer. Observers note that these systems often incorporate machine learning models trained on historical session data to predict future curve behavior, enabling proactive adjustments before significant losses occur in player acquisition metrics. Event triggers capture actions like button clicks, form submissions, and navigation between pages, which together form the raw material for curve calculations.
Implementation Across Virtual Wagering Platforms
Operators deploy these monitoring setups across sportsbooks, online casinos, and poker rooms where user journeys vary based on game type and regulatory requirements. In July 2026 several major platforms expanded their monitoring infrastructure to include multi-jurisdictional data aggregation that respects local privacy rules while maintaining unified curve analytics. Automated alerts notify teams when conversion rates fall below established thresholds for any demographic segment, prompting targeted interventions such as localized language adjustments or alternative payment options. Data shows that integration with customer relationship management tools allows operators to correlate curve positions with lifetime value projections derived from subsequent betting volume.
Data Aggregation and Pattern Recognition Techniques
Collection methods combine API calls from front-end applications with backend database queries that timestamp every interaction point. Analysts segment curves by acquisition channel, geographic region, and device category to isolate variables affecting progression rates. One documented approach involves cohort analysis where groups entering during the same week receive separate curve tracking, revealing how external factors like promotional campaigns influence long-term retention. Evidence from industry reports indicates that platforms using these segmented views achieve more precise identification of high-value user pathways compared with aggregate-only monitoring.
Regulatory and Compliance Integration
Automated systems must align with oversight frameworks established by bodies such as the Nevada Gaming Control Board and the Canadian Gaming Association, which require transparent record-keeping of user data flows. Monitoring tools incorporate audit logs that document every data access event, ensuring compliance during periodic reviews. Those responsible for system maintenance often embed compliance checks directly into the curve generation process, automatically redacting sensitive identifiers before analysis proceeds. This layered approach supports both operational insights and regulatory reporting without separate manual processes.
Future Developments in Curve Tracking
Emerging technologies focus on enhanced granularity through integration of behavioral biometrics and session replay capabilities that add qualitative context to quantitative curve data. Research from academic institutions continues to explore how real-time adjustments based on curve deviations can optimize user flows while maintaining platform integrity. Observers note that continued refinement of these automated processes will likely expand the range of measurable conversion events, extending beyond initial deposits to include recurring activity and cross-game migrations within virtual environments.
Conclusion
Tracing player conversion curves through automated monitoring provides wagering platforms with precise visibility into user progression dynamics across multiple touchpoints. The combination of continuous data collection, segmented analysis, and regulatory alignment supports sustained operational improvements in virtual environments. As monitoring capabilities advance, the resulting insights enable more responsive platform adjustments that reflect actual user behavior patterns recorded in real time.